http://www.worldmapsonline.com/np_geo/oceania_bathymetry_lg.htm
This Bathymetric map shows the sea floor for Oceania. Note the attention that it gives to the elevation of the sea floor.
Map Catalog
Monday, November 21, 2011
Sunday, November 20, 2011
Correlation matrix
http://www.renci.org/~sthakur/figs/Poly_Vis_similarity_matrix.jpg
This matrix show the similarity of two different chemical polymers.
Stem and leaf plot
http://mdk12.org/instruction/curriculum/mathematics/graph_stem.html
This simple stem and leaf plot chows the heights of several children in centimeters.
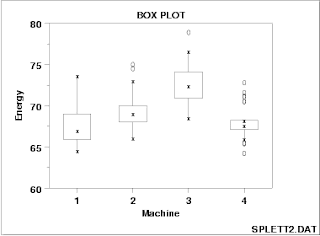
Box plot
http://itl.nist.gov/div898/handbook/eda/section3/boxplot.htm
These box plots compare the energy output of four different machines.
Histogram
http://www.worsleyschool.net/science/files/bargraphs/page.html
This simple histogram shows the frequency of certain masses of fish.
Parallel coordinate graph
http://www.whopaidthem.com/
This plot shows the results of a test that was meant to guess the test takers understanding of political funding.
Triangular plot
http://psychology.wikia.com/wiki/Lineage_(evolution)
Triangle plots allow for three different things to be compared. In this example shows where certain ethnicities fall within three distinct groups.
Subscribe to:
Posts (Atom)


